-
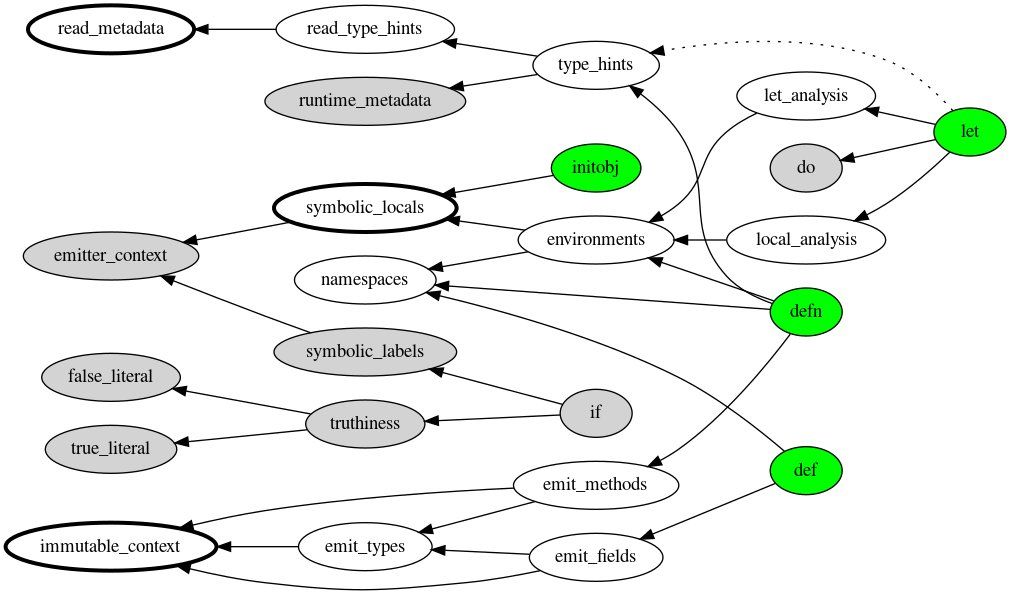
tweeted about this already, but i am super into this todo graph. managing it manually rn, but w some automation/graph theory it could be really powerful? green = high level feature, grey = done, thick stroke = next tasks, line = dependency, dotted line = related but not dependentOn twitter.com
 ♻️ 1 Retweets
❤️ 16 Favorites
Mood +4 🙂
♻️ 1 Retweets
❤️ 16 Favorites
Mood +4 🙂